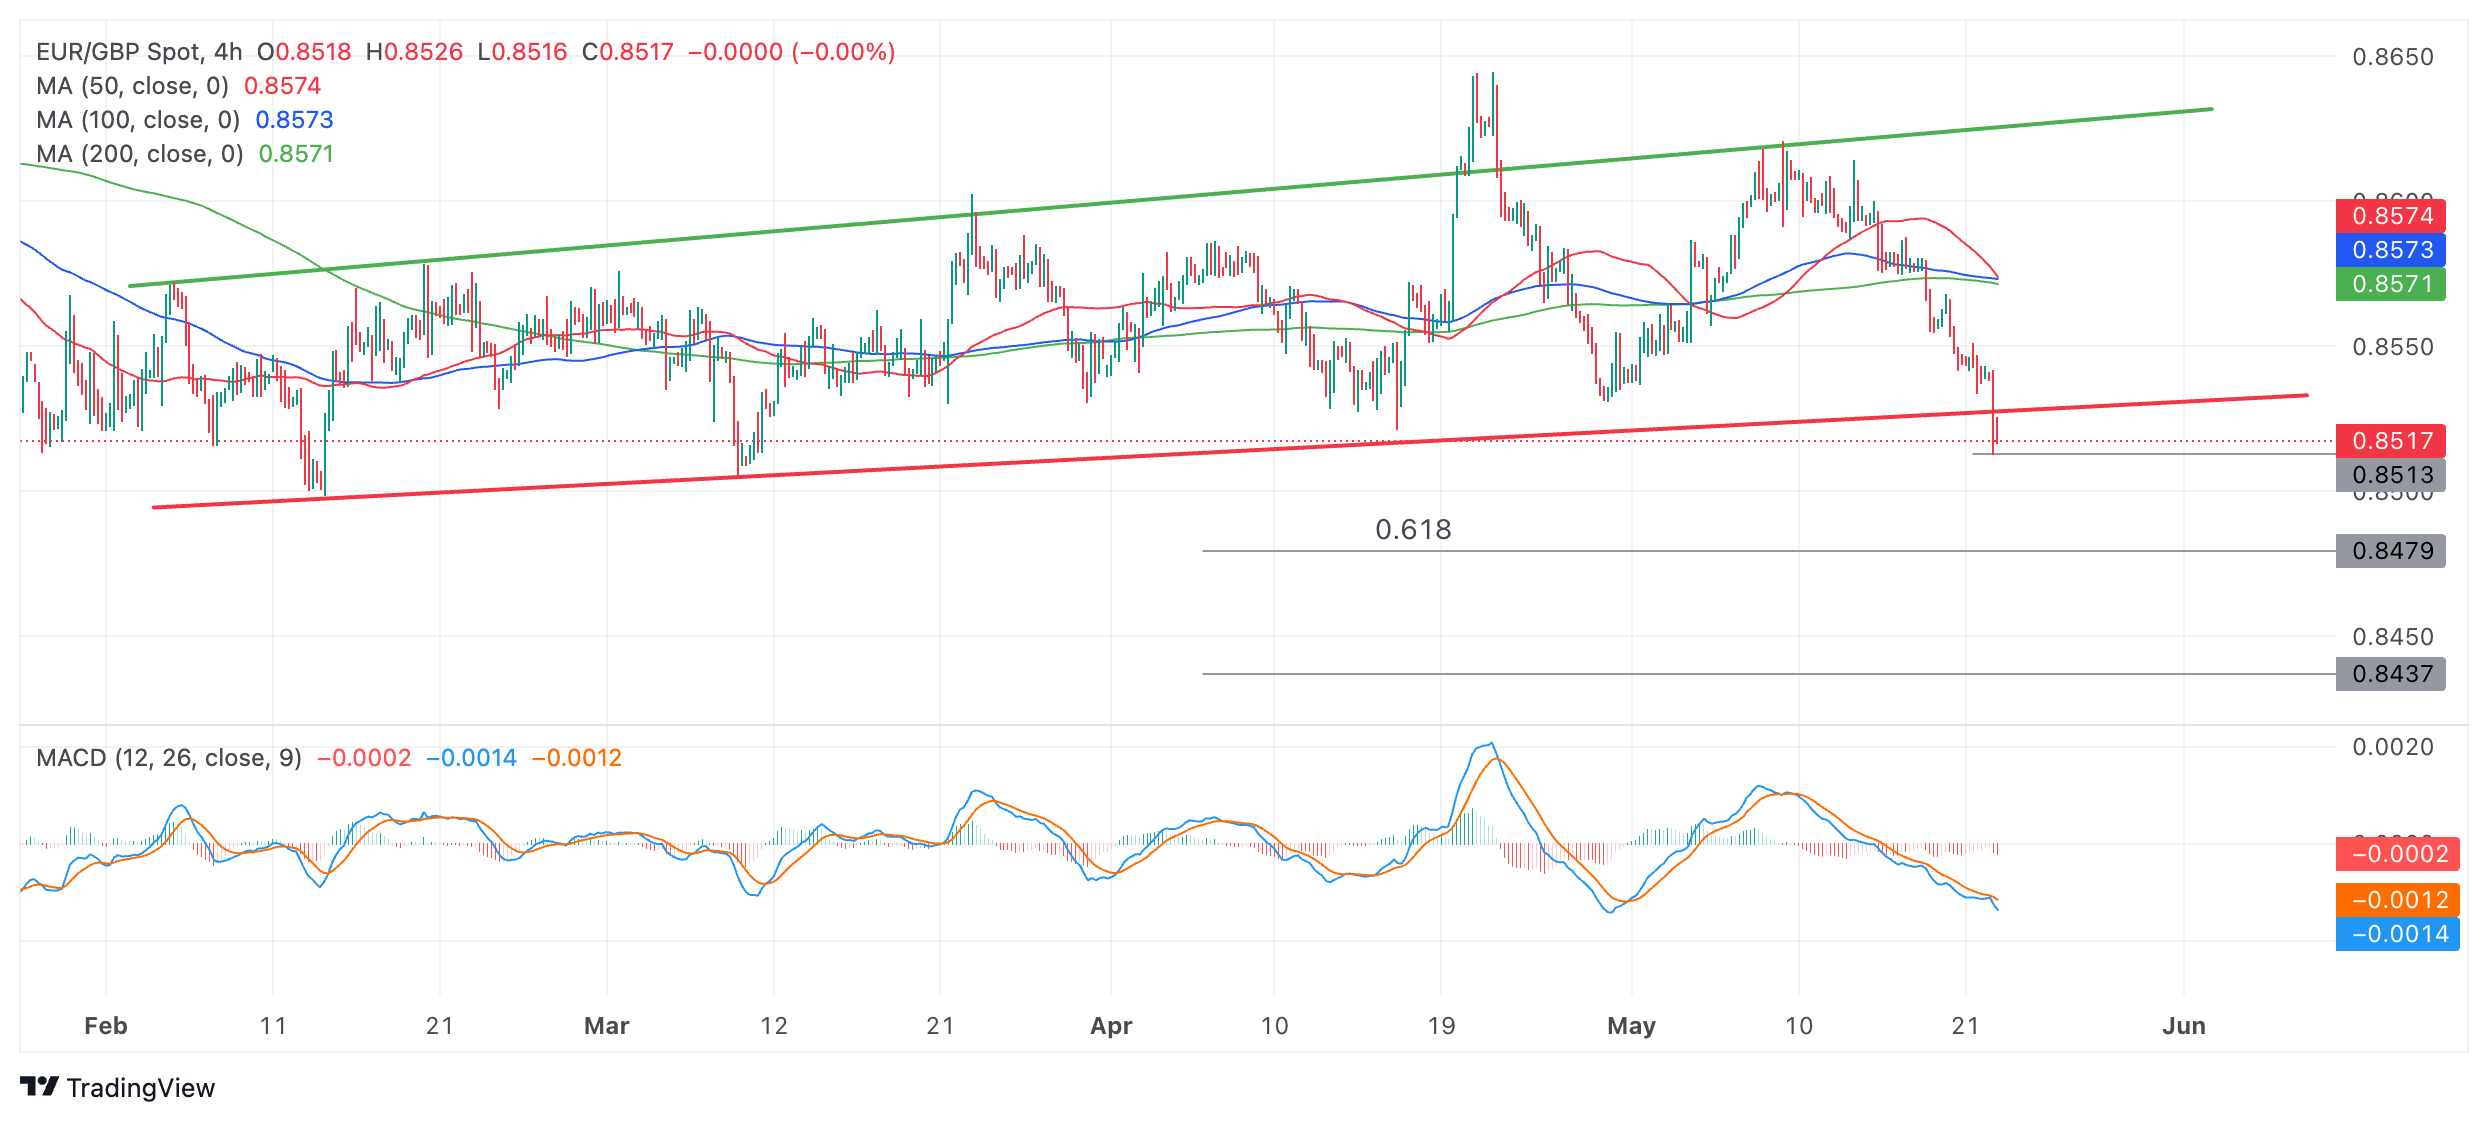
EUR/GBP Price Analysis: Breakdown from multi-month range
- EUR/GBP is breaking down out of a multi-month range it has been oscillating within since February.
- If price holds below the range lows it could lead to a substantial extension lower.
- A break back above the highs of the breakout candle would indicate the break was false.
EUR/GBP has fallen to the floor of a multi-month range and broken decisively below on a 4-hour period closing basis.
A close below the 0.8513 low of the candle that pierced through the floor would provide added confirmation of more downside.
EUR/GBP 4-hour Chart
The customary method for forecasting how far a breakout move will go is to take the height of the range and extrapolate it lower from the breakout point. This gives two targets: a conservative objective at the 0.618 Fibonacci ratio – and a more optimistic target at the full 100% of the height of the range extrapolated lower.
The conservative target lies at roughly 0.8479 and the more optimistic objective at 0.8437.
The Moving Average Convergence Divergence (MACD) indicator is in the negative zone and looking a little oversold. If it crosses back above the signal line it could signal a recovery. Crosses of the MACD above or below its signal line have been a reliable indicator of oscillations in price during the unfolding of the range.
There is a risk the break is a “false break” and price will recover and move back up inside the range. EUR/GBP is, after all, in a sideways trend, and “the trend is your friend”. A close back above the 0.8542 high of the breakdown candle would provide evidence the sideways trend is probably extending further. It would suggest a strong possibility of a move back up to the range high in the 0.8620s.

