Back
11 Feb 2020
GBP/USD Price Analysis: Pound correcting up from 2020 lows, bulls eyeing 1.3000 figure
- GBP/USD is rebounding from the 2020 lows as the market created a descending wedge.
- The levels to beat for bulls is the 1.2960 level.
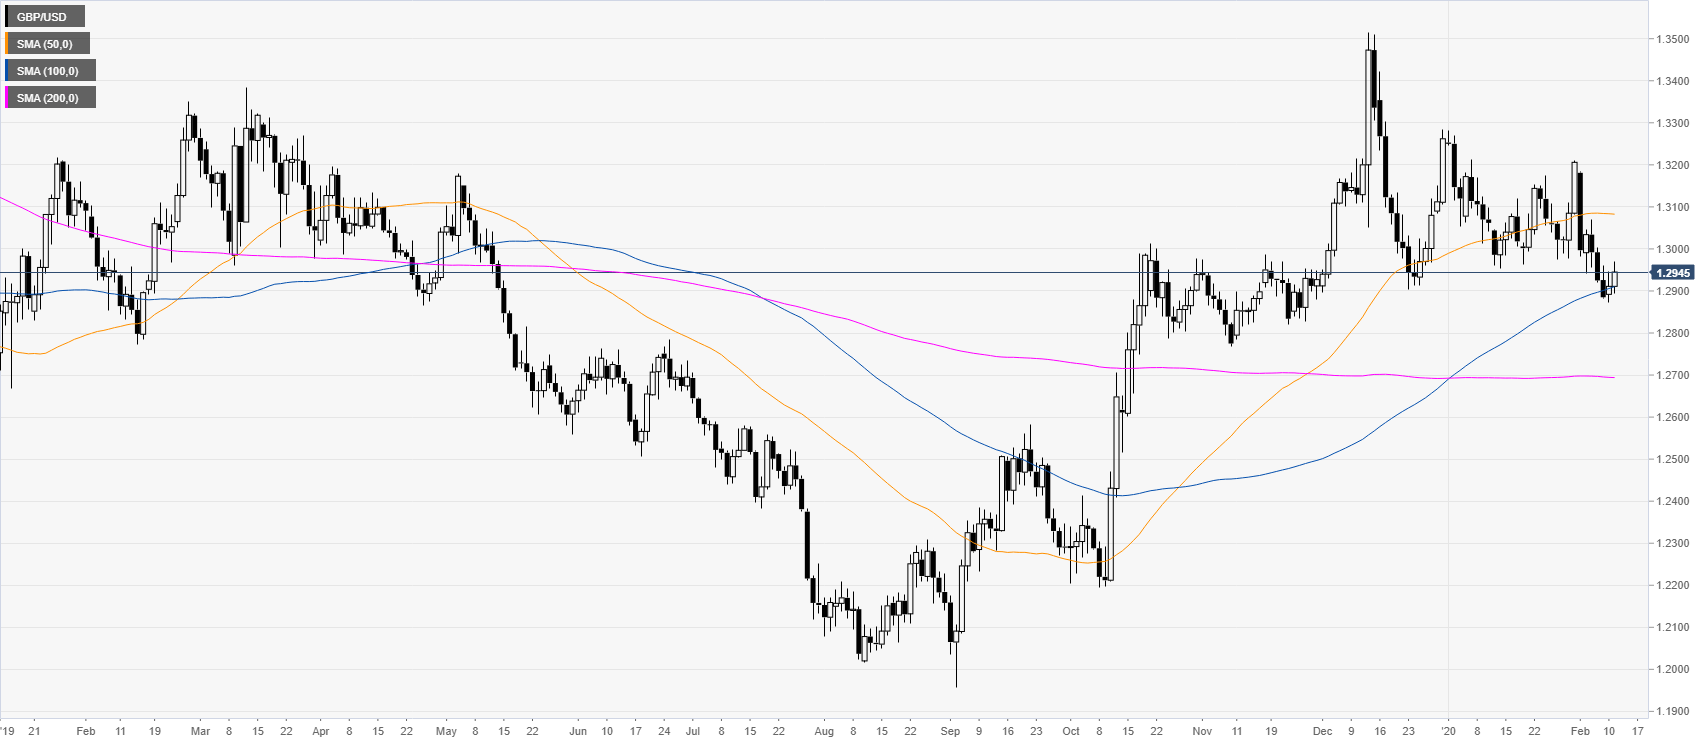
GBP/USD daily chart
After the October and December spikes, pound/dollar is trading in a rectangle consolidation above the 100/200-day simple moving averages (SMAs).
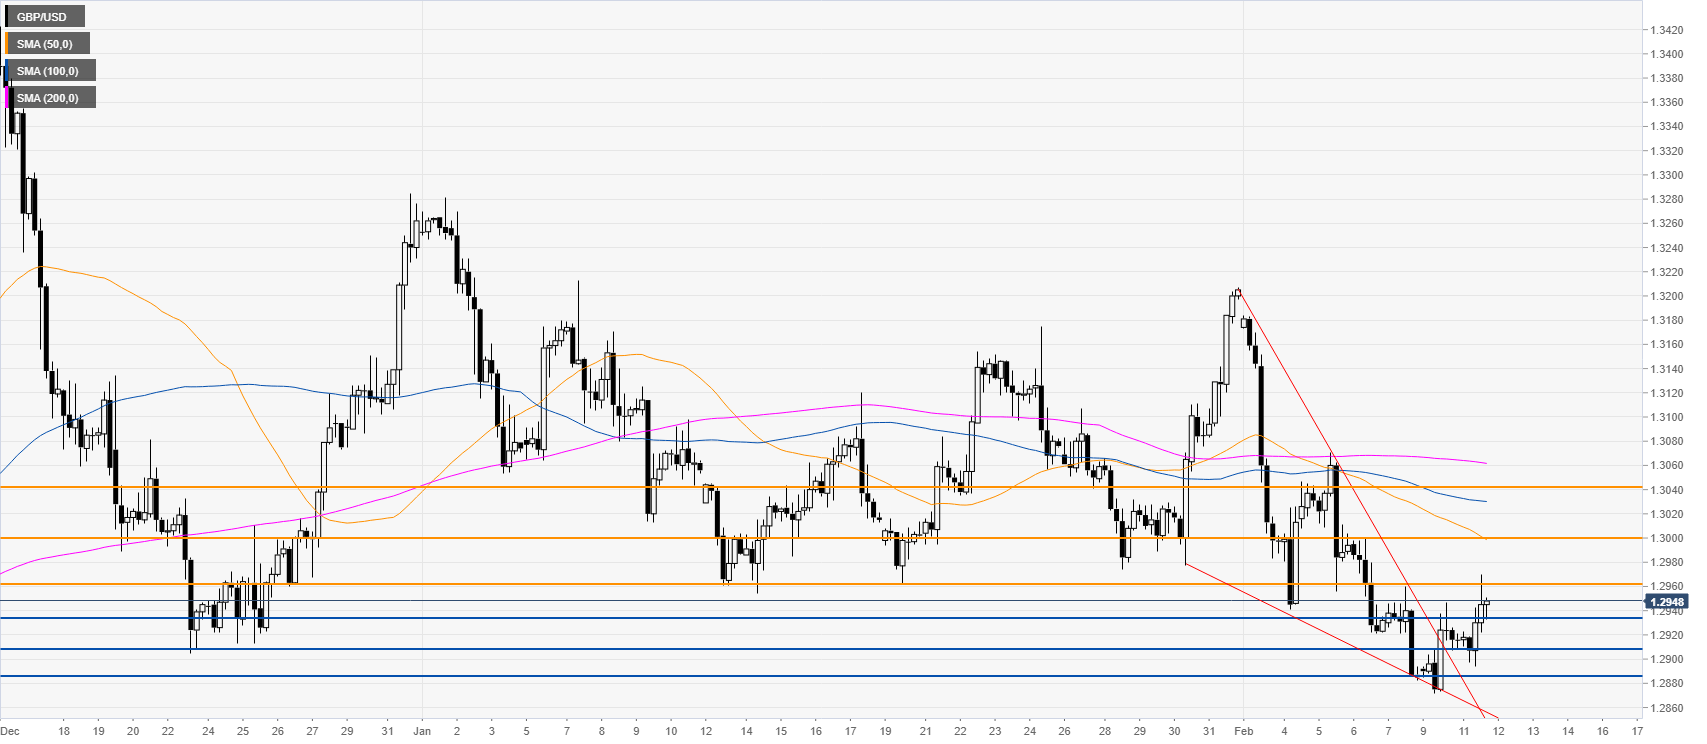
GBP/USD four-hour chart
The pound is correcting up after the market formed a descending wedge formation. Bulls are trying to overcome the 1.2960 resistance to drive the market towards the 1.3000 figure. Support is seen near the 1.2933 and 1.2910 price levels, according to the Technical Confluences Indicator.
Resistance: 1.2960, 1.3000, 1.3042
Support: 1.2933, 1.2910, 1.2885
Additional key levels