Back
24 Feb 2020
USD/JPY Price Analysis: Dollar accelerates correction down below 111.00 figure vs. yen
- USD/JPY is starting the week trading sharply down after a large bullish breakout last week.
- The correction down is extending below the 111.00 level.
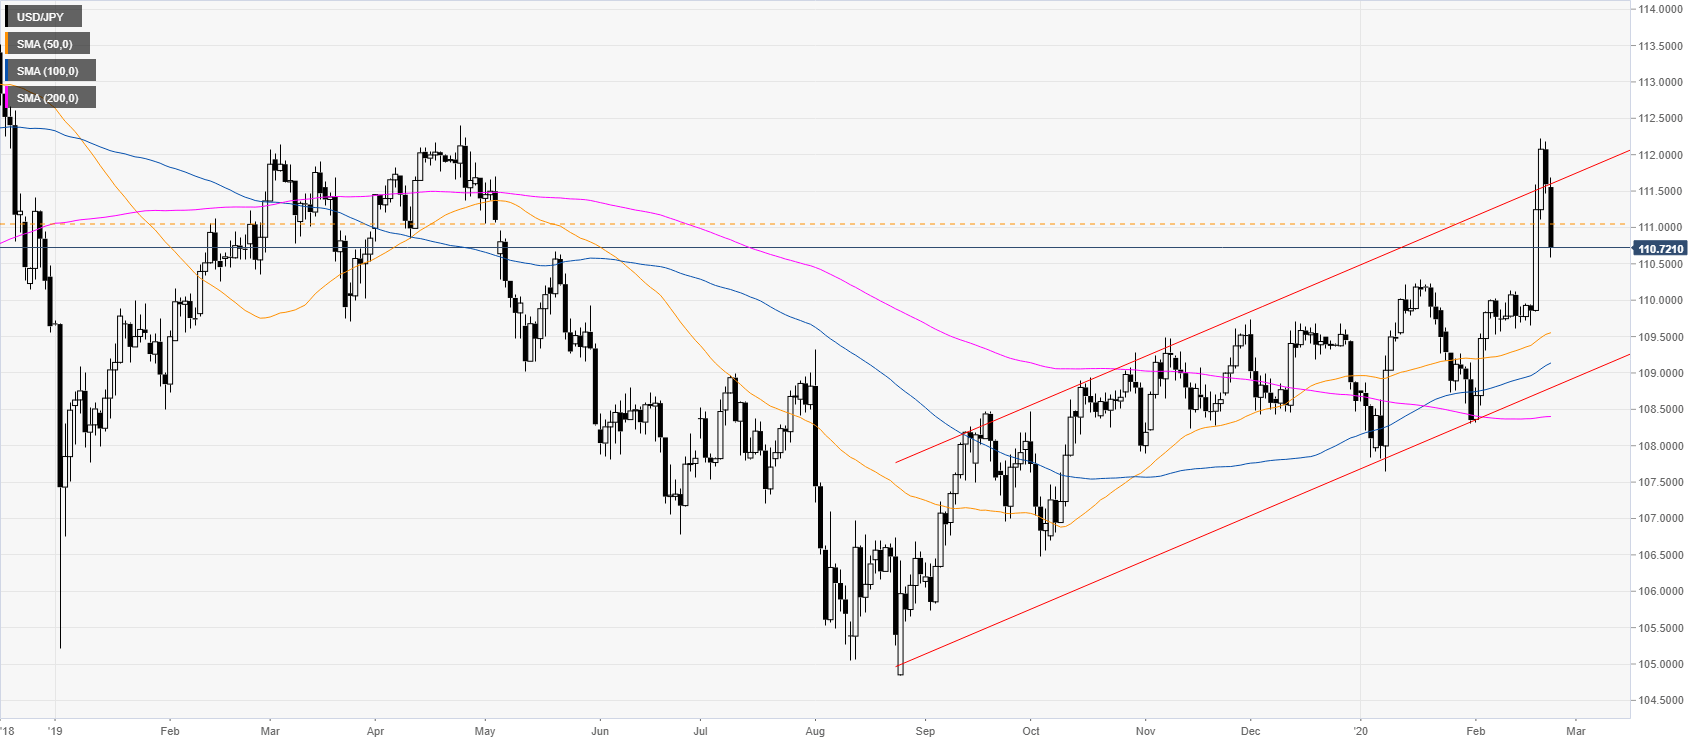
USD/JPY daily chart
USD/JPY is trading in an ascending channel while trading above the main daily simple moving averages (SMAs). The market is correcting down after two consecutive days of above-average intraday rallies.
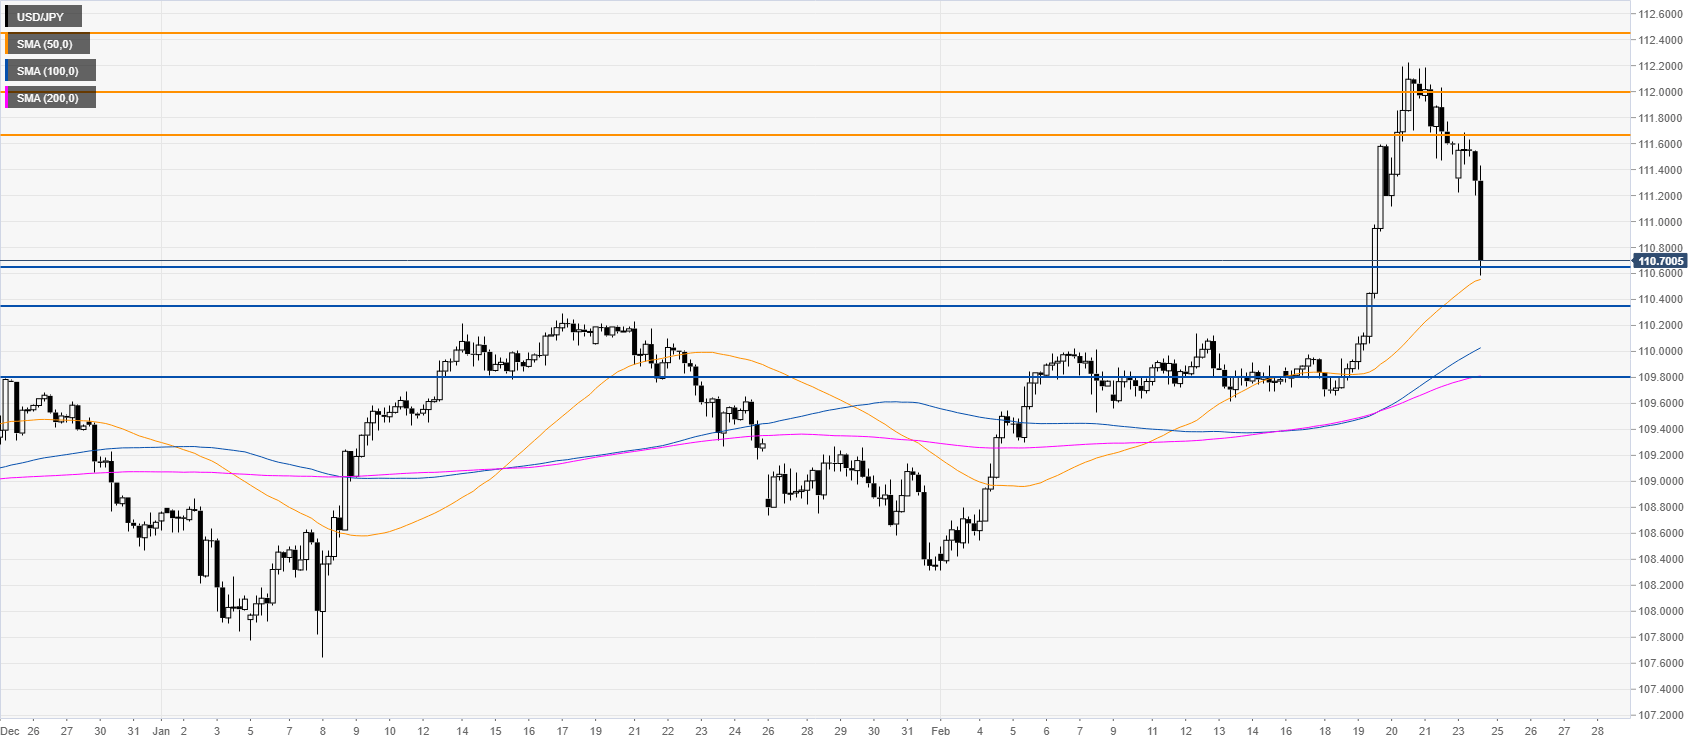
USD/JPY four-hour chart
Dollar/Yen is correcting down sharply after a very volatile last week. The spot is challenging the 110.65 support and a break below it could lead to further losses to the 110.35 and 109.80 levels. Resistance can be found near the 111.65 level, according to the Technical Confluences Indicator.
Resistance: 111.65, 112.00, 112.46
Support: 110.65, 110.35, 109.80
Additional key levels