AUD/USD Price Analysis: Struggles below 0.6660/65 key resistance confluence
- AUD/USD stays mildly negative following Aussie data.
- Bearish MACD, a sustained trading below the key upside barrier keep sellers hopeful.
- The recent candlestick formations portray the bears’ exhaustion.
AUD/USD takes rounds to 0.6600 following the release of a second-tier data from Australia during Wednesday’s Asian session.
Australia’s fourth quarter (Q4) Construction Work Done slumped 3.0% versus -1.0% expectations and +0.4% upwardly revised prior. Even so, the data had little impact on the Aussie pair.
However, the quote remains below 0.6660/65 resistance confluence including the early-month lows and a downward sloping trend line since January 01, 2020.
That said, the pair’s candlestick formations during the last two days suggest the bears also fail to cheer the MACD signal and rather like to wait for a sustained break below 0.6585 for fresh entry.
Hence, traders might witness the continuation of a lower grind unless prices stay in the range of 0.6585-0.6665.
However, an upside clearance of the same could quickly cross 0.6700 mark to challenge the monthly top near 0.6775.
AUD/USD daily chart
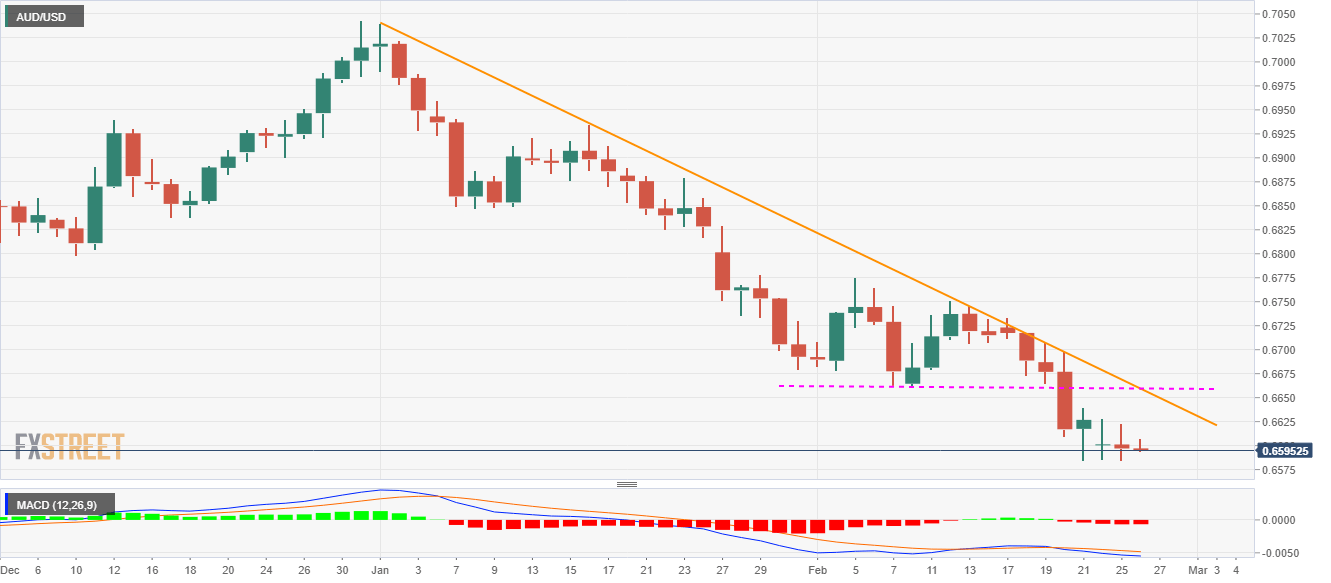
Trend: Bearish