Back


27 Feb 2020
GBP/USD Price Analysis: Pound hovering near multi-month lows, sub-1.2900 figure
- GBP/USD is consolidating losses after hitting levels not seen since November 2019.
- The level to beat for bears is the 1.2861 support.
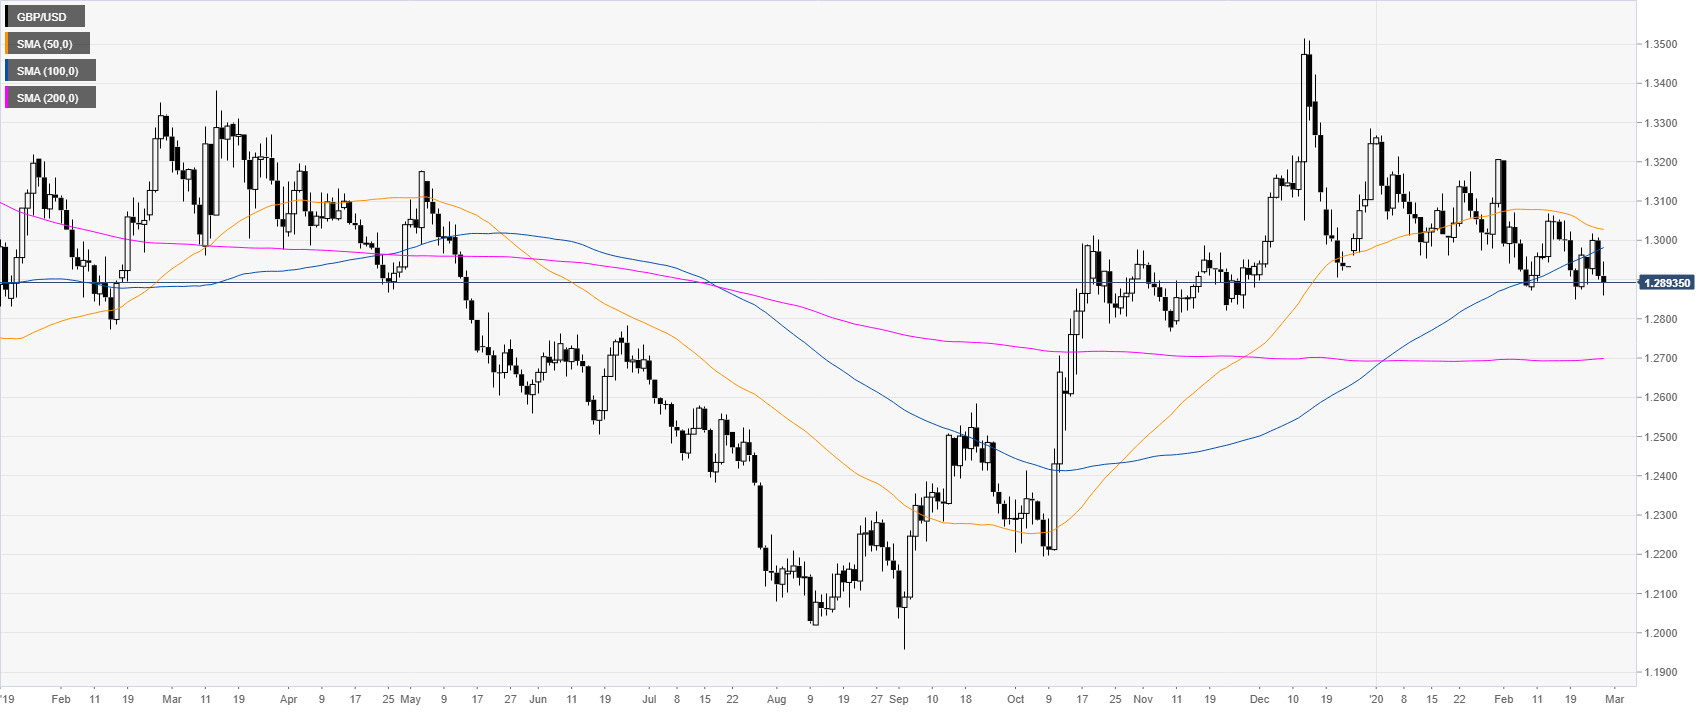
GBP/USD daily chart
After the October and December bull-market, GBP/USD is trading in a rectangle consolidation above the 200-day simple moving averages (SMAs).

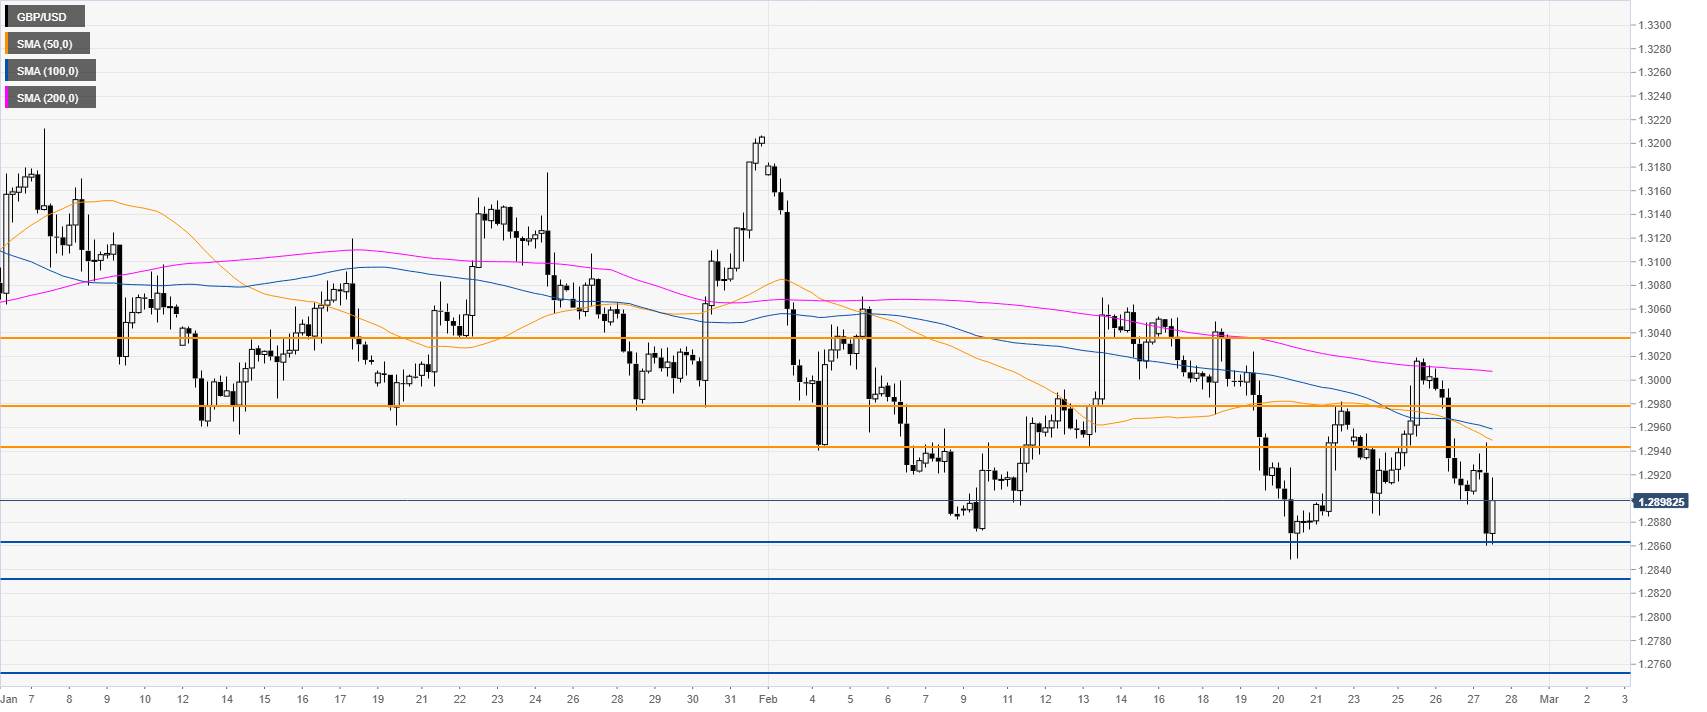
GBP/USD four-hour chart
Pound/Dollar is consolidating losses after reaching levels not seen since November 2019. The currency pair remains relatively weak, especially on a break below the 1.2861 support. Downside targets can be seen near the 1.2835 and 1.2731 levels. On the flip side, bullish attempts might find resistance near the 1.2941, 1.2981 and 1.3000 levels, according to the Technical Confluences Indicator.

Resistance: 1.2941, 1.2981, 1.3000
Support: 1.2861, 1.2835, 1.2731
Additional key levels
